NetworkX visualization with Graphviz (Example)

If you are trying to visualize a nice graph with NetworkX, you should be exhausted by now. After all, NetworkX only provides basic functionality for graph visualization. The main goal of NetworkX is to enable graph analysis. For everything other than basic visualization, it’s advisable to use a separate specialized library. In my case, I choose Graphviz. It’s simplistic to get an attractive visualization of a NetworkX graph with Graphviz. I’m taking a gradual start, but you may skip to “NetworkX with Graphviz” directly.
NetworkX with Matplotlib
Let’s start small, so we can see the issue here. I’m trying to plot a simple directed graph (more like a tree).
import networkx as nx
import matplotlib.pyplot as plt

G = nx.DiGraph()
G.add_edges_from([('A', 'B'), ('A', 'C'), ('A', 'D'), ('E', 'D'), ('D', 'F'), ('E', 'C'), ('E', 'G'), ('B', 'H'), ('H', 'F')])
pos = nx.spring_layout(G)
nx.draw_networkx(G, pos)
plt.show()

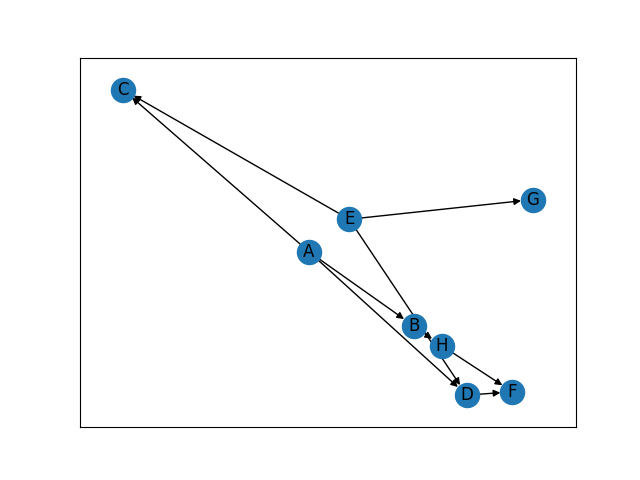
The main issue I had here was the layout. When the number of nodes increases, the layout becomes messy. And the none of the limited set of layouts seems to be working. So the first option is to use a graphviz layout without much change.
Using Graphviz layout with the existing plot
Here we are just trying to get a better layout without any change to the graph look and feel. Note that you need to install the Graphviz before going to next step. (download). With Windows, you can download the setup from the above page. For Ubuntu, you can easily install that with below command (Graphviz and some needed libraries)
sudo apt-get install graphviz libgraphviz-dev pkg-config
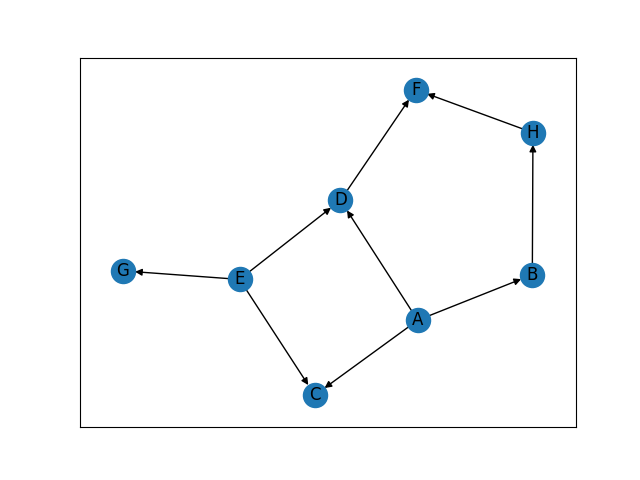
Then we use the Graphviz layout (I use the default one here) to generate the positions of the nodes. Here I have exported it as a png, rather than showing it.
pos = nx.nx_pydot.graphviz_layout(G)
nx.draw_networkx(G, pos)
plt.savefig('networkx_graph.png')

As you can see the layout already looks better. However if you want to take the full advantage/power of Graphviz, you need to convert this to a Graphviz graph.
NetworkX with Graphviz
We can directly convert to a Graphviz graph. First, install pygraphviz. Then run the code.
pip install pygraphviz
A = nx.nx_agraph.to_agraph(G)
A.layout()
A.draw('networkx_graph.png')
You can use an intermediate dot file, if you are working with 2 applications or if you want to store the graph structure.
nx.drawing.nx_pydot.write_dot(p_graph, 'networkx_graph.png')
gv.render('dot', 'png', 'networkx_graph.png')
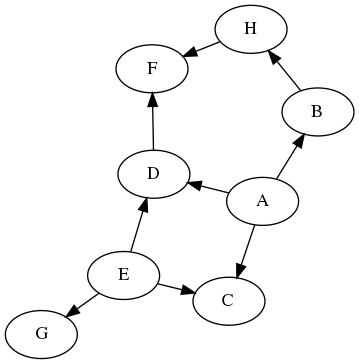
Both of these will generate the following graph. You can do any modification as you wish (Documentation).

Enjoy Reading This Article?
Here are some more articles you might like to read next: